
Dividends are a significant driver of returns for most Australian equity investors.
We understand many investors are looking for yield to provide passive income, especially when you include the benefits of franking credits.
Dividend stocks have many benefits, such as:
- Dividend-paying stocks give investors a way to earn returns during rocky market periods.
- When they grow over time, they may provide some protection against inflation.
- Income from dividends is tax-advantaged compared to income from fixed income investments.
- On average, dividend-paying stocks are less volatile than non-dividend-paying stocks.
- Over time, dividends, especially when reinvested to take advantage of compounding, can help build wealth.
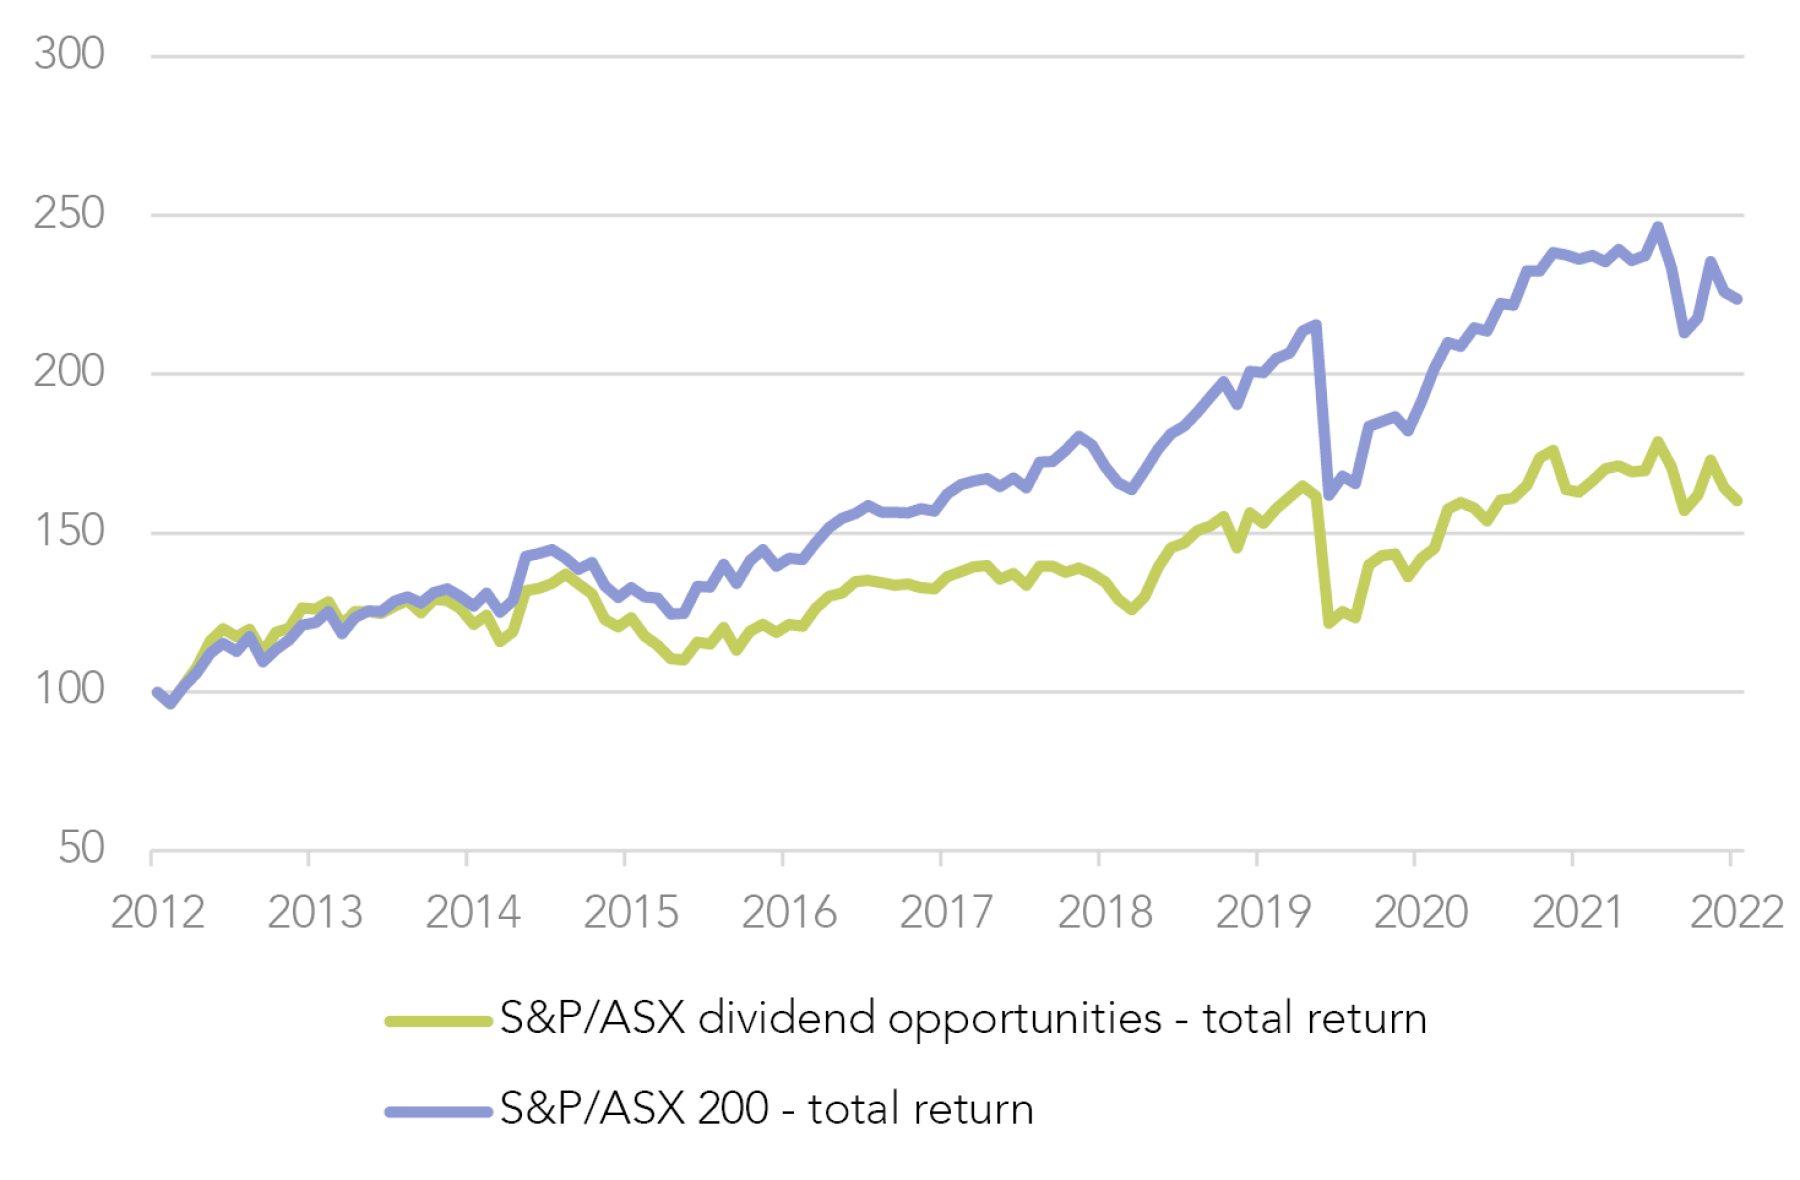
However, high yield stocks have proven to underperform the market on a long-term view. We therefore believe a dividend strategy cannot solely rely on high yielding stocks to be successful.
Looking for Yield Growth
We look for dividend-paying companies that can deliver growth year over year, continuously compounding cash flows each year. This is the template for companies we consider when thinking about income investing.
These companies typically increase the dividends they pay to shareholders due to their cash flow growth. However, market yields may be lower as investors are already pricing in some of the future capital returns into equity prices.
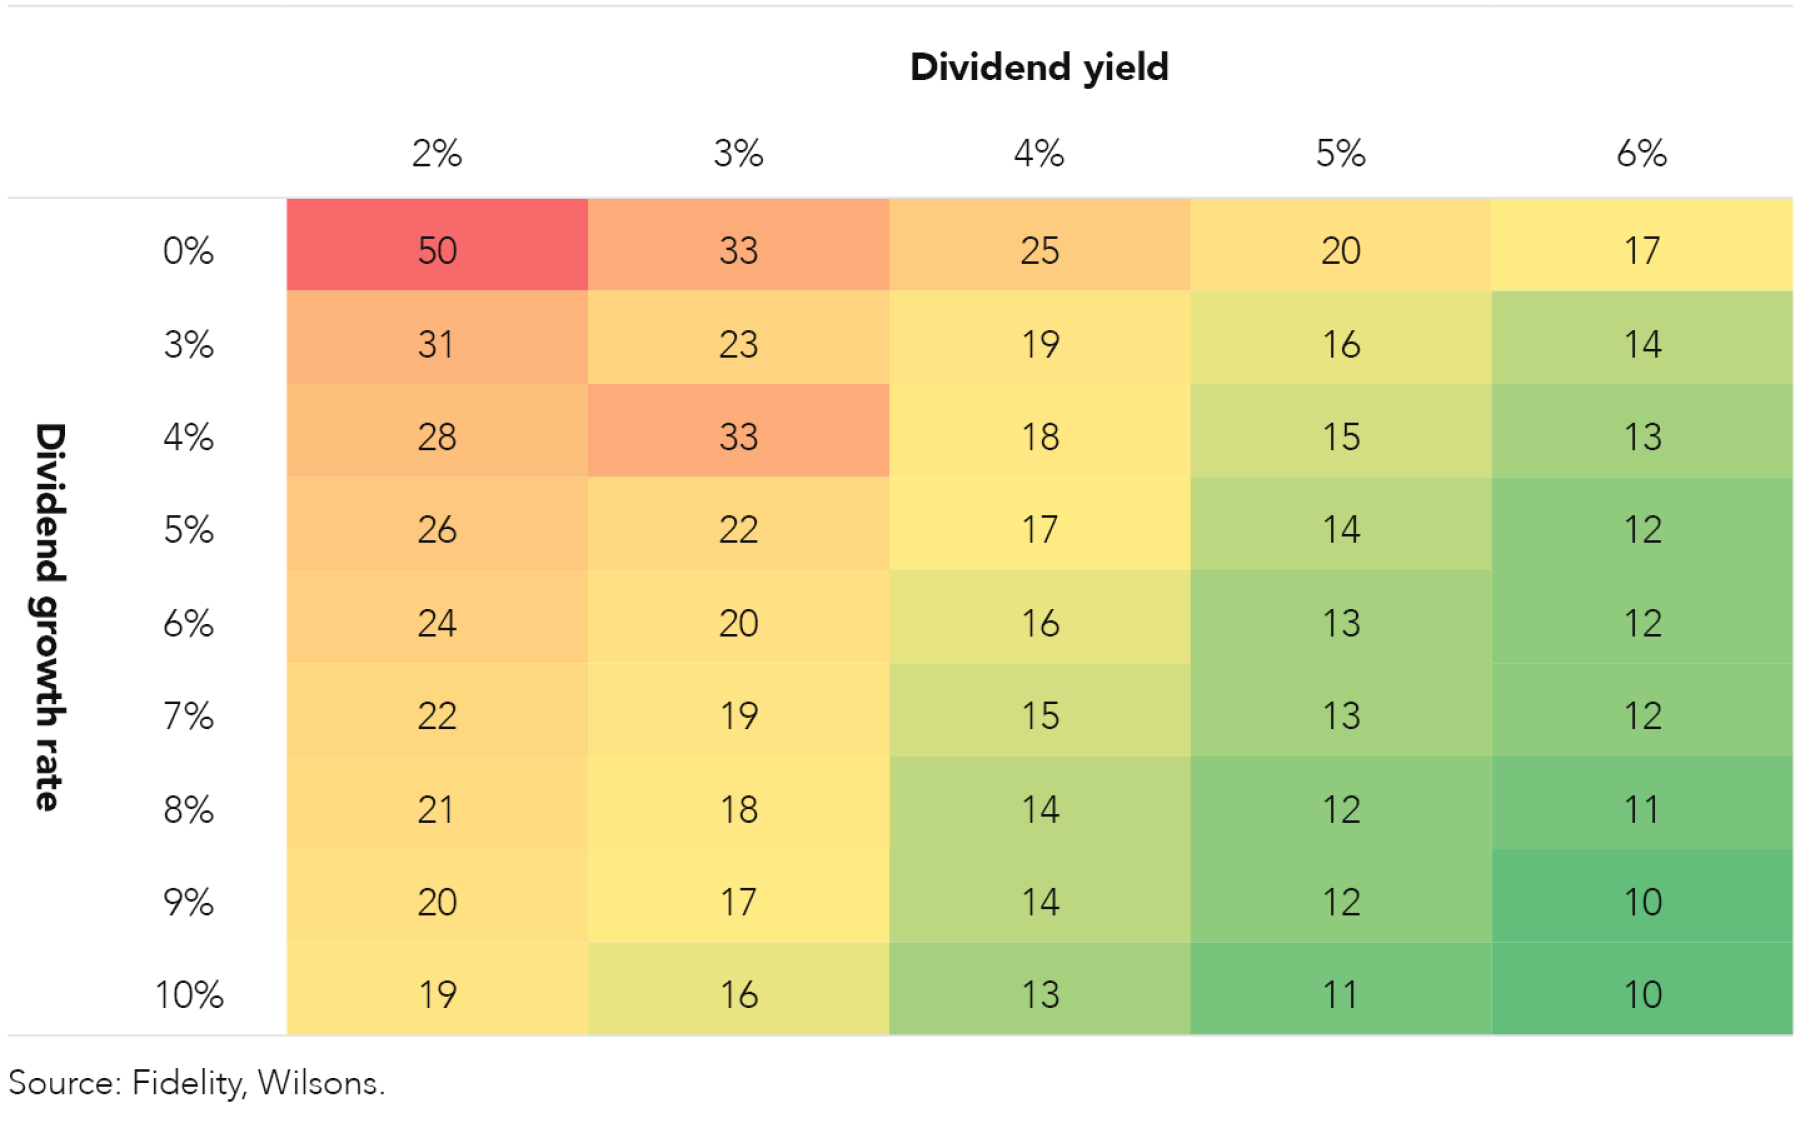
We think selecting a dividend strategy by its initial yield is a poor choice because the growth of the dividend over time ultimately determines the income payouts in future years.
Although a simple concept, the payback matrix lays out a simple methodology for considering yield stocks. The payback of a stock indicates how long (in years) it would take for the dividend payments from a company to pay off the initial investment. Figure 2 shows how dividend growth can substantially accelerate the payback on an investment vs a stock that has little growth.
Case Study – APA Group (APA) vs GPT Group (GPT)
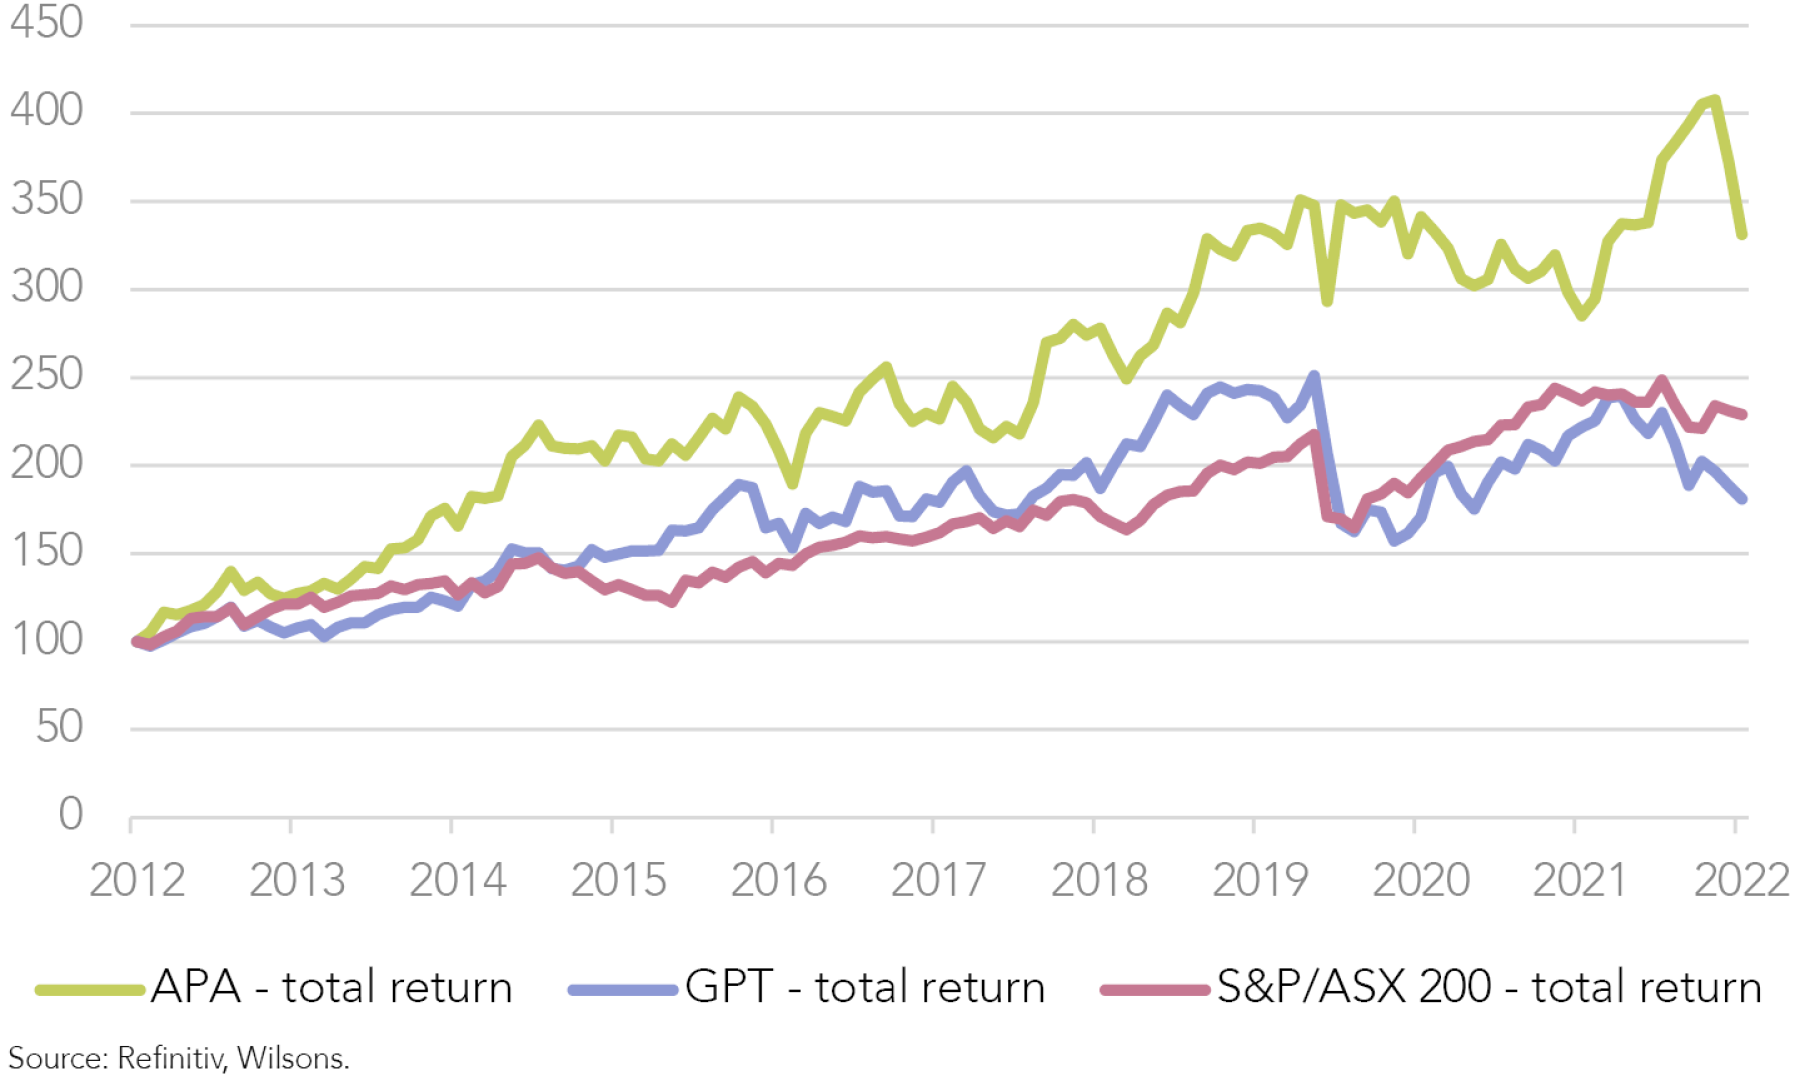
We take APA and GPT as an interesting case study to demonstrate how important growth is for dividend investing.
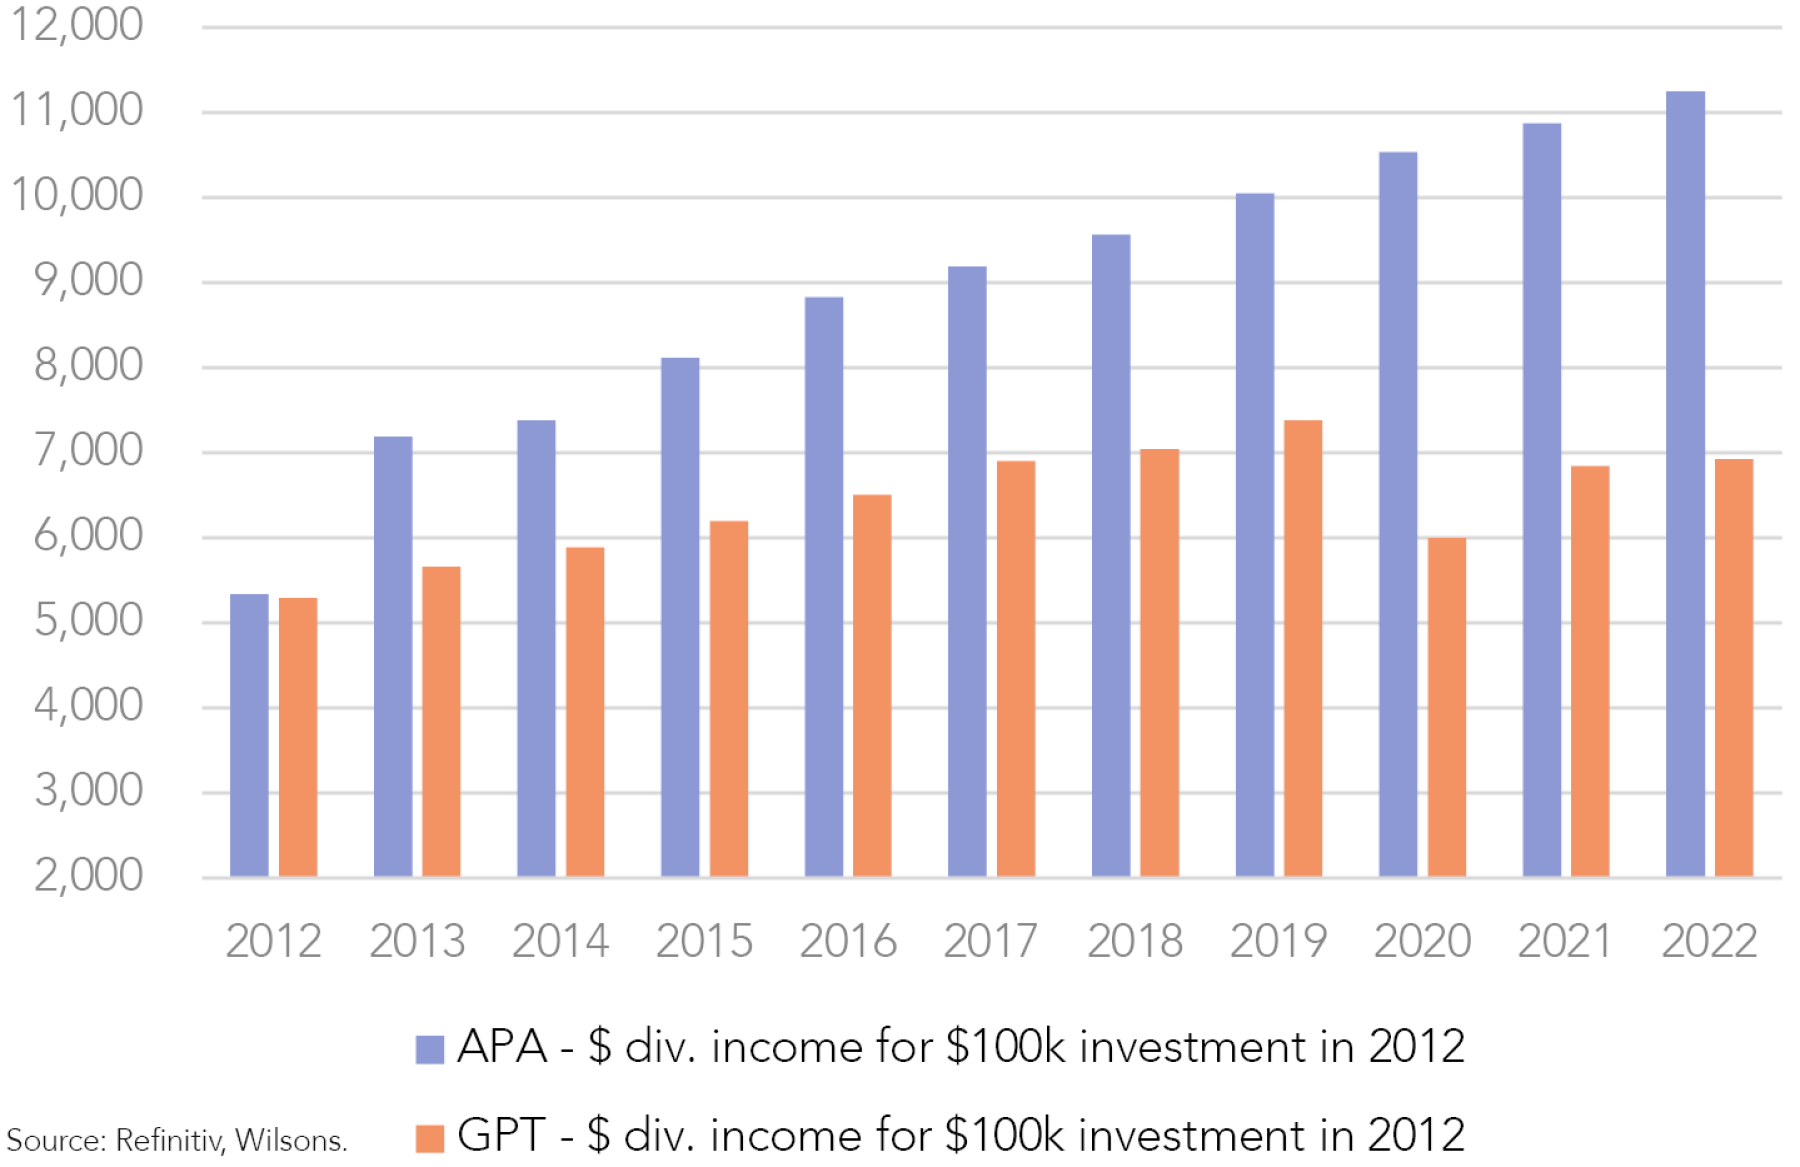
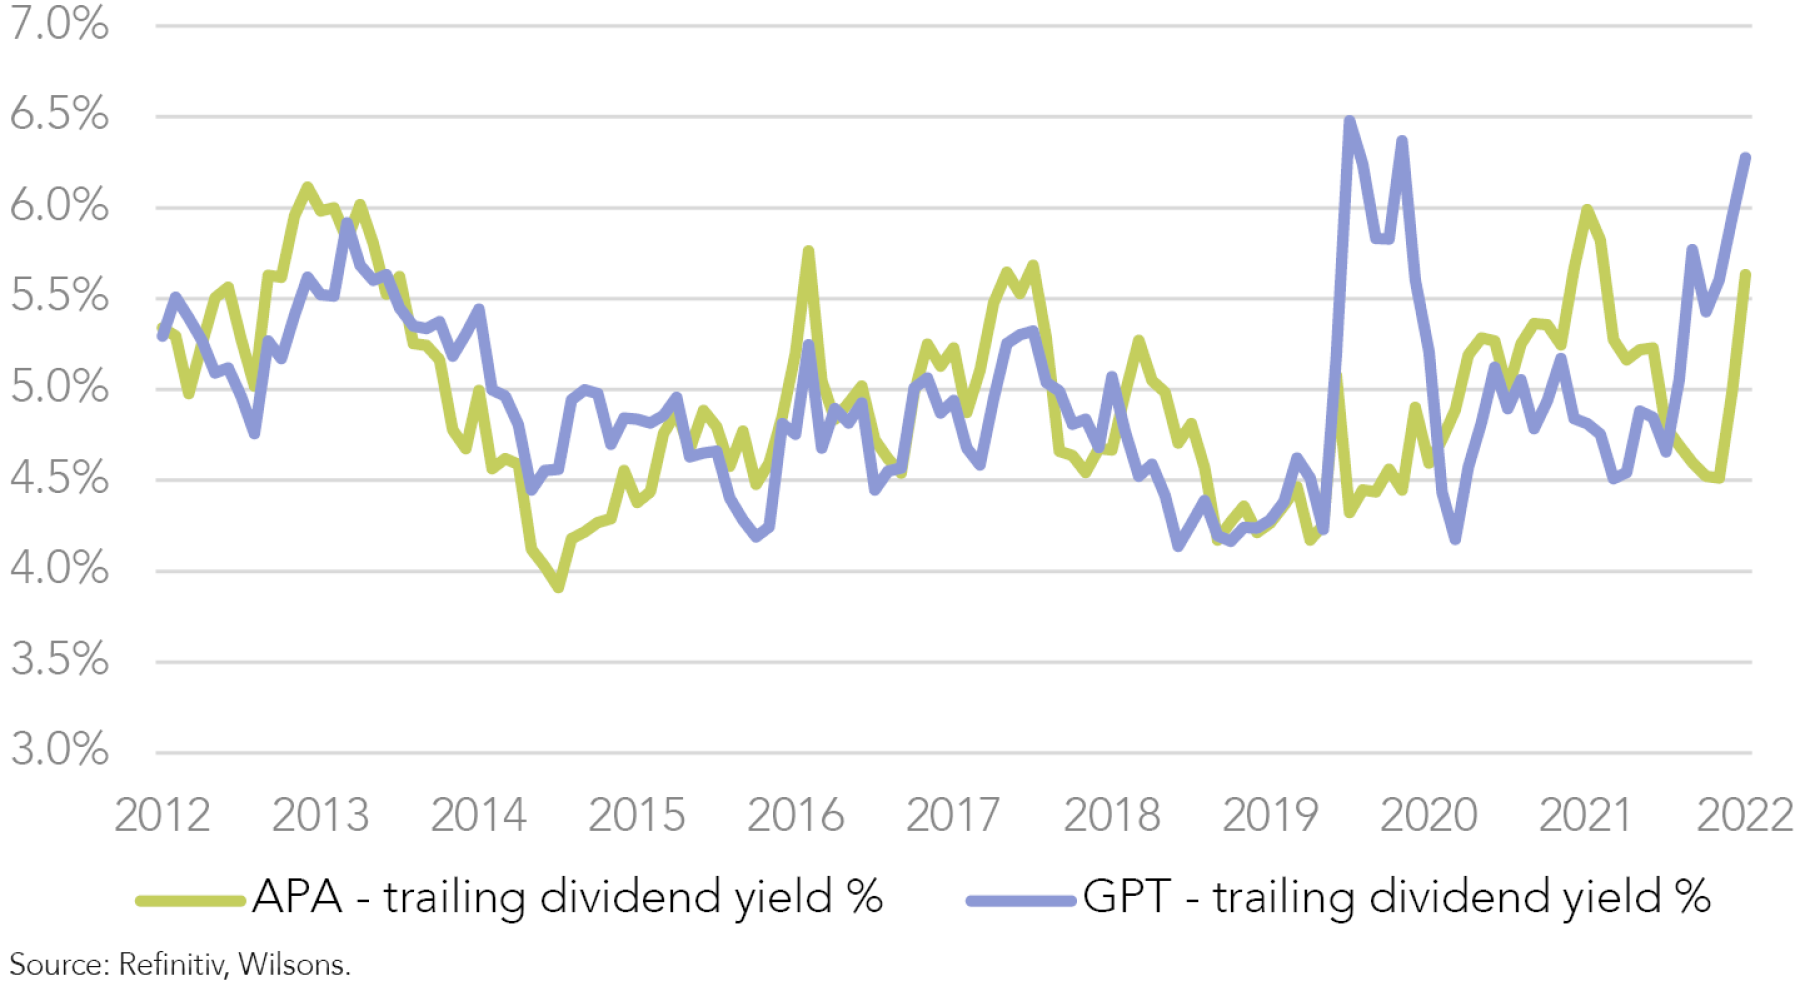
If we invested $100k into APA and GPT in 2012 we would have received a 5.3% yield, so around $5.3k in income for the year for both stocks. By today, the 2012 ($100k) investment in APA would be generating an income of $11.2k or 11.2% yield vs GPT which would be generating $6.9k of income or a 6.9% yield.
The actual market yields of APA or GPT have not diverged significantly over the last 10 years; both stocks are expected to generate a ~5-6% yield if you invested today. However, the share price of APA has appreciated inline with the income growth and this has led to a significantly higher total return than GPT. The key here is to take a long-term approach when it comes to dividend investing.
Low Dividend-yielding Stocks Aren't Inevitably Low-income Investments (In The Long Run)
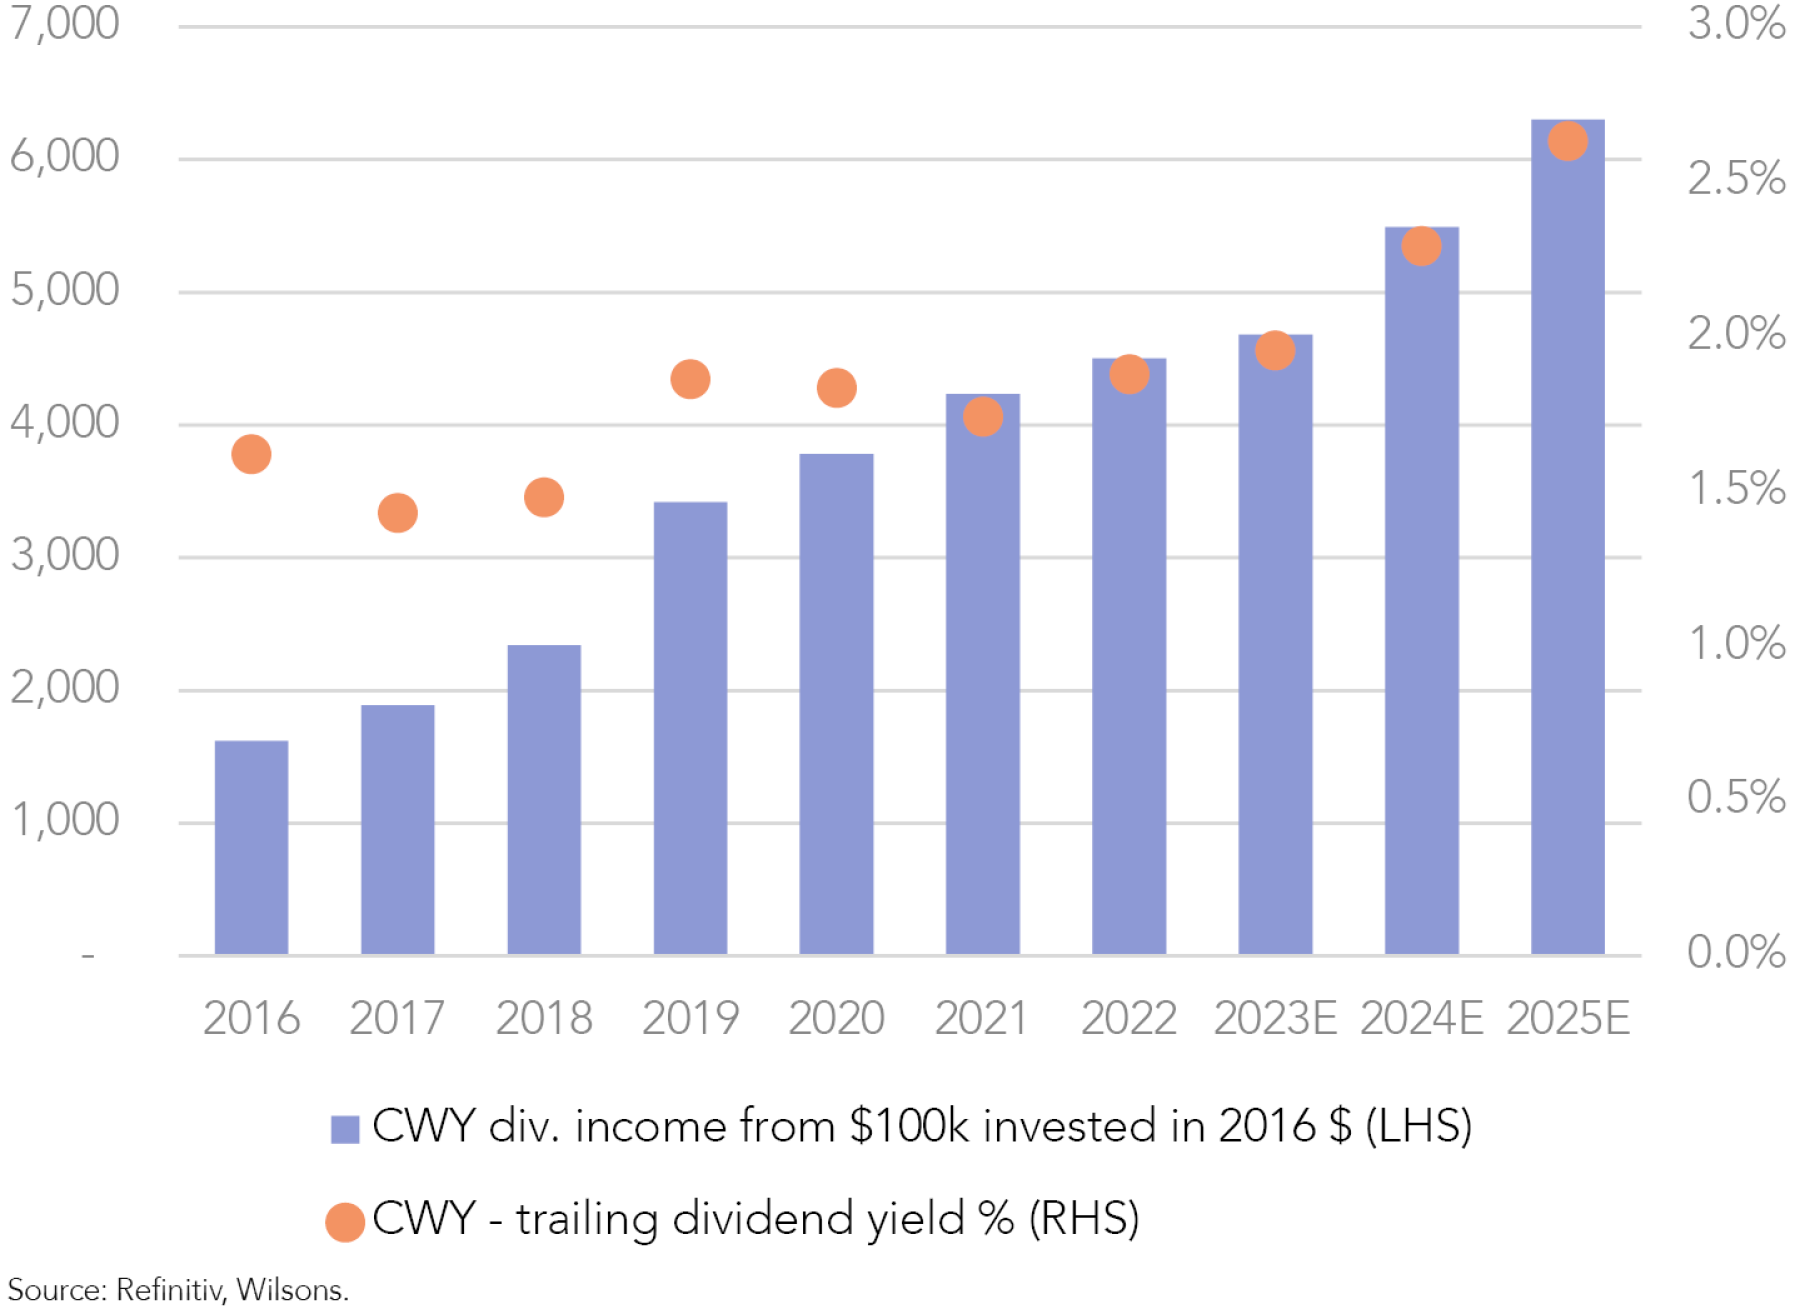
Over the long-term, high-dividend-yield stocks do not guarantee higher dividend income. Dividend yield and share price appreciation join forces to deliver attractive returns over time. A good example of this is Cleanaway (CWY), the ASX 100 waste management company.
The consistently low dividend yield of CWY causes income-focused investors to overlook this stock, and other stocks like it. Nevertheless, a dissection of shareholder returns shows strong earnings and dividend growth have contributed to long-term income growth. CWY has outperformed its benchmark as a result over the past decade. Furthermore, the actual income on a $100k investment in CWY in 2016 is expected to be $6.3k by 2025.
Seeking Sustainable Businesses
Over the last decade, the average dividend yield of the ASX 200 is around 4.5%. However, it is worth considering that dividends are paid at the discretion of the company board, not the shareholders. Even profitable companies cut their dividends due to uncertainty, prioritising balance sheet strength over capital returns.
As a result, we believe it is worth focusing on companies that should generate income, regardless of the macro backdrop. These tend to be sustainable, high-quality businesses.
A high-quality, sustainable dividend stock should also grow its dividend as it is likely to have stable, growing earnings and solid fundamentals. Consequently, they are better positioned to weather potential slowdowns or exogenous shocks.
Conversely, some high-dividend yield stocks tend to be lower quality with less flexibility during tougher times. They often carry more debt and devote more cash flow to paying dividends, leading to higher share price volatility during periods of market turmoil.
Keeping the Portfolio Diversified
An equity income strategy that uses this growth approach is better equipped to offer a diversified portfolio that can potentially withstand market volatility. Many high yield income strategies have a high concentration on resource companies and the banks. We think a growth strategy should also lead to less concentration risk.
Holistic Approach to Returns
Overall, we think it is worth taking a holistic view of total return when considering a dividend strategy. Investors should adopt a total return approach when selecting stocks for their portfolios by thinking long-term and understanding that earnings growth will support long-term dividend income.
Screening the ASX for Income
It is important to look beyond just ‘spot’ yields when constructing income-oriented portfolios.
This simplistic approach can lead to a selection of companies with weak or deteriorating outlooks, which – counterintuitively - can result in relatively weak dividend-based returns in the fullness of time.
Therefore, we think it is also paramount to consider companies based on their competitive positioning and industry backdrop, their earnings quality, and their long-term growth outlook.
Accordingly, below we have screened the ASX 100 based on:
- FY25 dividend yield > 2%.
- 3-year forecast DPS CAGR – ideally this should be positive or at least flat. Long-term earnings growth is the main driver of investment income over time (not the current dividend yield).
- A balance between growth and yield. I.e. a high yield stock can have lower growth but a low yield stock (2-3%) needs significant growth (>10% DPS CAGR).
- Earnings quality – a qualitative assessment of earnings cyclicality/defensiveness. Our preference is towards companies with predictable earnings underpinned by relatively defensive demand through the cycle.
- Competitive moat / industry backdrop – we favour companies with strong positions in attractive industries that are benefiting from structural tailwinds (or at least, not plagued by disruption/structural headwinds).
- In resources, we have screened out the high-yielding iron ore miners who we believe are in structural decline, and kept the oil & gas and lithium miners who we believe are in a structural uptrend.
| Name | Ticker | Dividend Yield % FY0 | Dividend Yield % FY3 | DPS CAGR % (FY0-FY3) |
| Higher Yielding Screen - FY3 Yield Above 3% | ||||
| Westpac Banking Corp | WBC | 5.0% | 6.6% | 9% |
| Australia and New Zealand Banking Group Ltd | ANZ | 5.6% | 6.4% | 5% |
| Scentre Group | SCG | 5.5% | 6.3% | 5% |
| APA Group | APA | 5.6% | 6.2% | 4% |
| Insurance Australia Group Ltd | IAG | 2.3% | 5.9% | 38% |
| National Australia Bank Ltd | NAB | 4.1% | 5.6% | 11% |
| Ampol Ltd | ALD | 3.0% | 5.6% | 23% |
| Transurban Group | TCL | 3.3% | 5.4% | 18% |
| Telstra Corporation Ltd | TLS | 4.2% | 5.0% | 7% |
| Woodside Energy Group Ltd | WDS | 4.0% | 5.0% | 8% |
| Mineral Resources Ltd | MIN | 1.4% | 4.7% | 50% |
| Wesfarmers Ltd | WES | 4.0% | 4.7% | 6% |
| Medibank Private Ltd | MPL | 3.8% | 4.7% | 7% |
| Macquarie Group Ltd | MQG | 3.9% | 4.4% | 5% |
| Domino's Pizza Enterprises Ltd | DMP | 2.7% | 4.3% | 16% |
| Charter Hall Group | CHC | 3.5% | 4.1% | 6% |
| Carsales.Com Ltd | CAR | 2.6% | 3.8% | 13% |
| Treasury Wine Estates Ltd | TWE | 2.4% | 3.8% | 15% |
| ALS Ltd | ALQ | 2.9% | 3.7% | 8% |
| Steadfast Group Ltd | SDF | 2.6% | 3.5% | 10% |
| Woolworths Group Ltd | WOW | 2.7% | 3.5% | 8% |
| Seek Ltd | SEK | 2.2% | 3.1% | 13% |
| Higher Growth Screen - FY3 Yield Above 2% (below 3%) | ||||
| James Hardie Industries PLC | JHX | 2.1% | 2.8% | 10% |
| Brambles Ltd | BXB | 2.0% | 2.8% | 12% |
| COMPUTERSHARE LIMITED | CPU | 1.5% | 2.7% | 20% |
| Cleanaway Waste Management Ltd | CWY | 1.8% | 2.6% | 13% |
| IGO Ltd | IGO | 0.7% | 2.4% | 55% |
| IDP Education Ltd | IEL | 1.0% | 2.4% | 37% |
| Santos Ltd | STO | 1.8% | 2.4% | 10% |
| Aristocrat Leisure Ltd | ALL | 1.2% | 2.2% | 23% |
| REA Group Ltd | REA | 1.4% | 2.1% | 15% |
| Cochlear Ltd | COH | 1.5% | 2.1% | 12% |
*FY0 is the last reported result.
*FY3 is the forecast number for 3 years in advance. For June year ends this would be FY25.
Source: Refinitiv, Wilsons.

Written by
Rob Crookston, Equity Strategist
Rob is an experienced research analyst with a background in both equity strategy and macroeconomics. He has a strong knowledge of equity strategy, asset allocation, and financial and econometric modelling.
About Wilsons Advisory: Wilsons Advisory is a financial advisory firm focused on delivering strategic and investment advice for people with ambition – whether they be a private investor, corporate, fund manager or global institution. Its client-first, whole of firm approach allows Wilsons Advisory to partner with clients for the long-term and provide the wide range of financial and advisory services they may require throughout their financial future. Wilsons Advisory is staff-owned and has offices across Australia.
Disclaimer: This communication has been prepared by Wilsons Advisory and Stockbroking Limited (ACN 010 529 665; AFSL 238375) and/or Wilsons Corporate Finance Limited (ACN 057 547 323; AFSL 238383) (collectively “Wilsons Advisory”). It is being supplied to you solely for your information and no action should be taken on the basis of or in reliance on this communication. To the extent that any information prepared by Wilsons Advisory contains a financial product advice, it is general advice only and has been prepared by Wilsons Advisory without reference to your objectives, financial situation or needs. You should consider the appropriateness of the advice in light of your own objectives, financial situation and needs before following or relying on the advice. You should also obtain a copy of, and consider, any relevant disclosure document before making any decision to acquire or dispose of a financial product. Wilsons Advisory's Financial Services Guide is available at wilsonsadvisory.com.au/disclosures.
All investments carry risk. Different investment strategies can carry different levels of risk, depending on the assets that make up that strategy. The value of investments and the level of returns will vary. Future returns may differ from past returns and past performance is not a reliable guide to future performance. On that basis, any advice should not be relied on to make any investment decisions without first consulting with your financial adviser. If you do not currently have an adviser, please contact us and we would be happy to connect you with a Wilsons Advisory representative.
To the extent that any specific documents or products are referred to, please also ensure that you obtain the relevant disclosure documents such as Product Disclosure Statement(s), Prospectus(es) and Investment Program(s) before considering any related investments.
Wilsons Advisory and their associates may have received and may continue to receive fees from any company or companies referred to in this communication (the “Companies”) in relation to corporate advisory, underwriting or other professional investment services. Please see relevant Wilsons Advisory disclosures at www.wilsonsadvisory.com.au/disclosures.
