
With the US market now having rallied 17% from its mid-June lows (after a 24% correction), there is considerable debate as to whether the current rally is merely a bear market rally, or whether the rebound represents a more durable turning point into a new bull market phase.
While we are keeping an open mind (and a close eye on the data), our base case is that this rebound represents more than just a bear market rally.
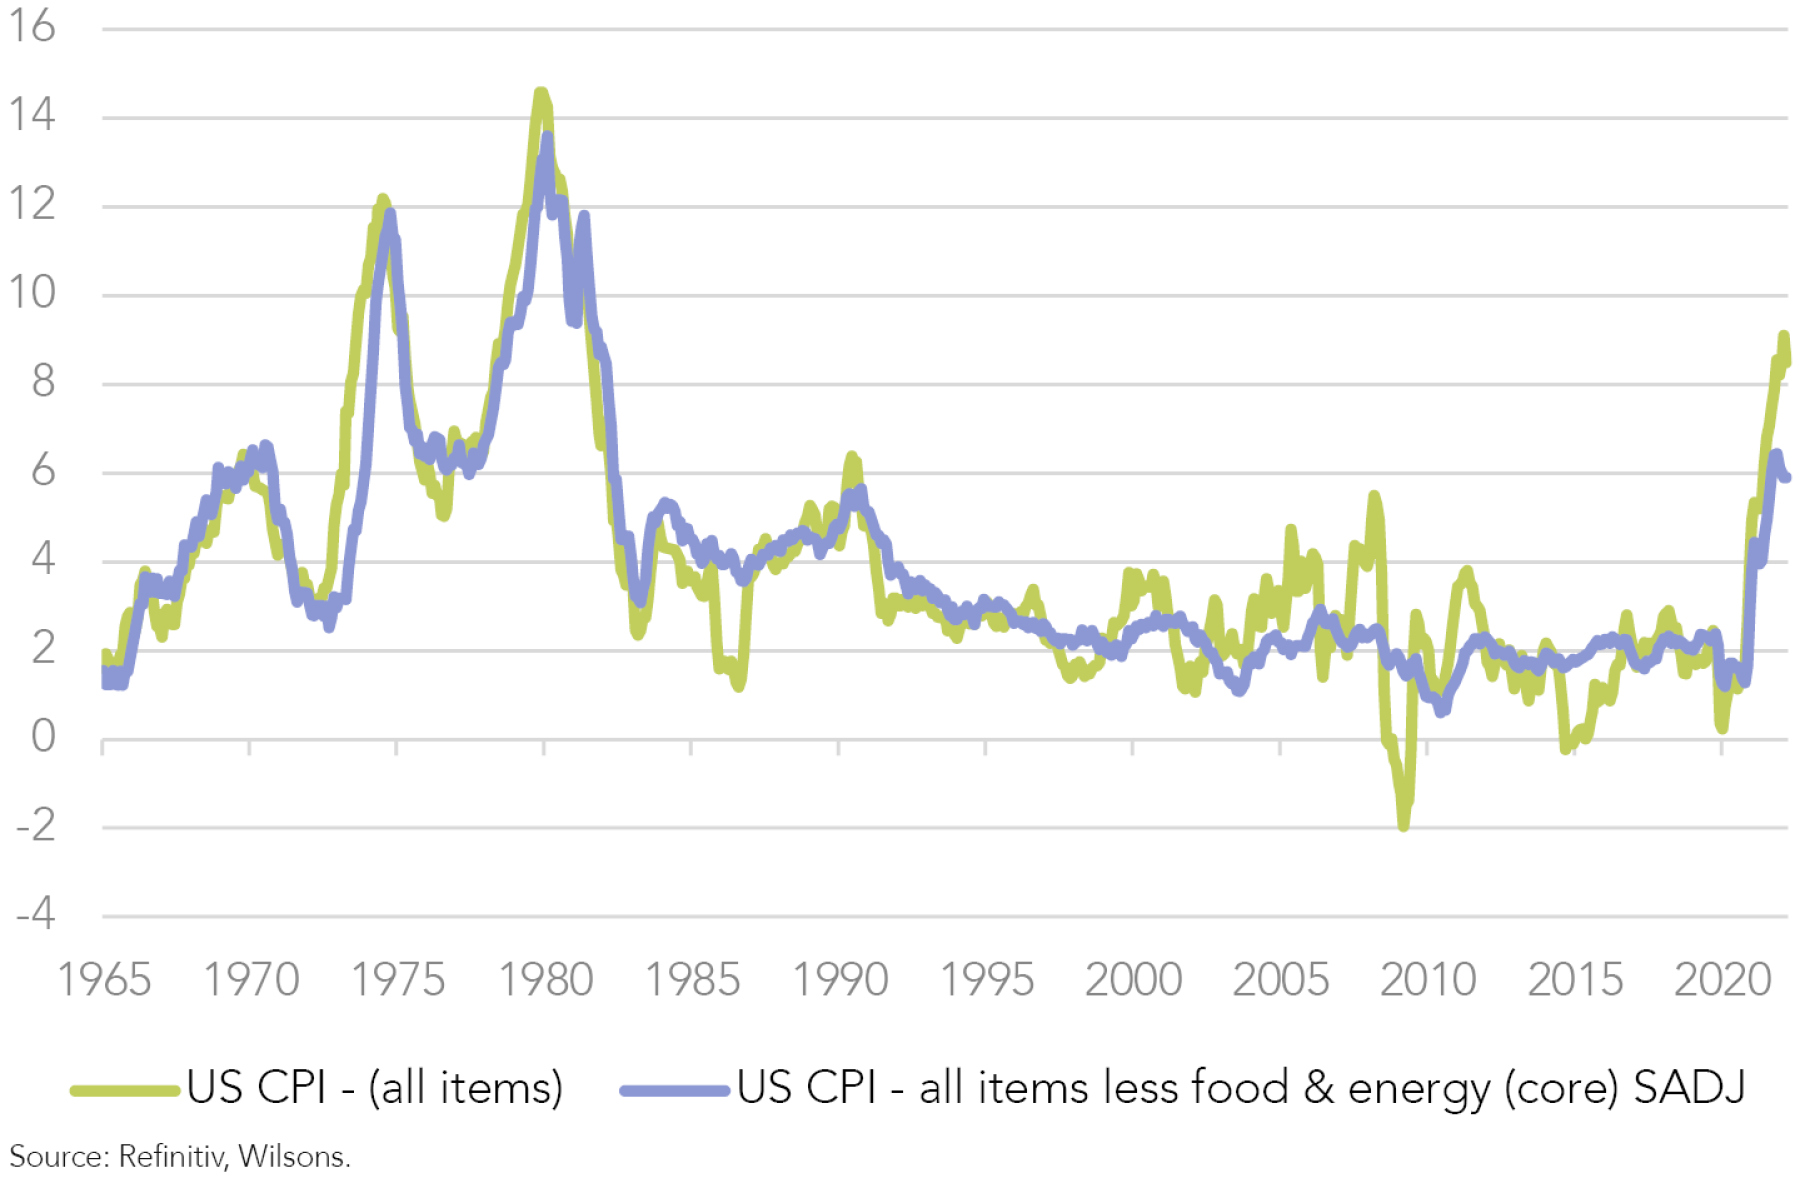
Central to this view is that US inflation has now hit a major downward inflection point that will allow the Fed to halt its tightening cycle before year-end, and to ease policy some time next year. This should allow the US to avoid a genuine recession in 2023, limiting the downside for 2023 earnings.
Our inflation view is based on both an easing in consumer demand as the US economy slows and an ongoing improvement in the global supply chain. We expect inflation to fall significantly over the coming year.
Bear Market Rallies are Relatively Common (in Bear Market Conditions)
We are cognizant that bear market rallies are relatively commonplace, so a 17% rally in itself is not a clear signal that a fresh uptrend is under way. Bear market rallies tend to occur in prolonged bear markets, which occur during long recessions when investors’ hopes for an end to the bear phase are repeatedly dashed.
| Rally Days | % rise | |
| Jan 73-Oct 74 bear market | ||
| Jul-73 | 10 | 9% |
| Aug-73 - Oct-73 | 51 | 11% |
| Dec-73 - Jan-74 | 29 | 8% |
| Feb-74 - Mar-74 | 31 | 10% |
| Sep-74 | 7 | 8% |
| Sep 76-Feb78 bear market | ||
| Nov-76 - Dec-76 | 51 | 9% |
| Nov 80-Mar-82 bear market | ||
| Dec-80 - Jan-81 | 26 | 9% |
| Feb-81 - Mar-81 | 51 | 8% |
| Sep-81 - Nov-81 | 66 | 12% |
| Sep 00- Jul 02 bear market | ||
| Dec-00 - Feb-01 | 43 | 9% |
| Apr-01 - May-01 | 47 | 19% |
| Sep-01 - Dec-01 | 75 | 21% |
| Feb-02 - Mar-02 | 32 | 8% |
| Oct 07-Mar 09 bear market | ||
| Mar-08 - May-08 | 70 | 12% |
| Jun 22-Aug 22 (Bear or Bull Market Rally?) | 61? | 17%? |
Source: Refinitiv, Wilsons.
Fundamentals will Dictate the Medium-term Trend
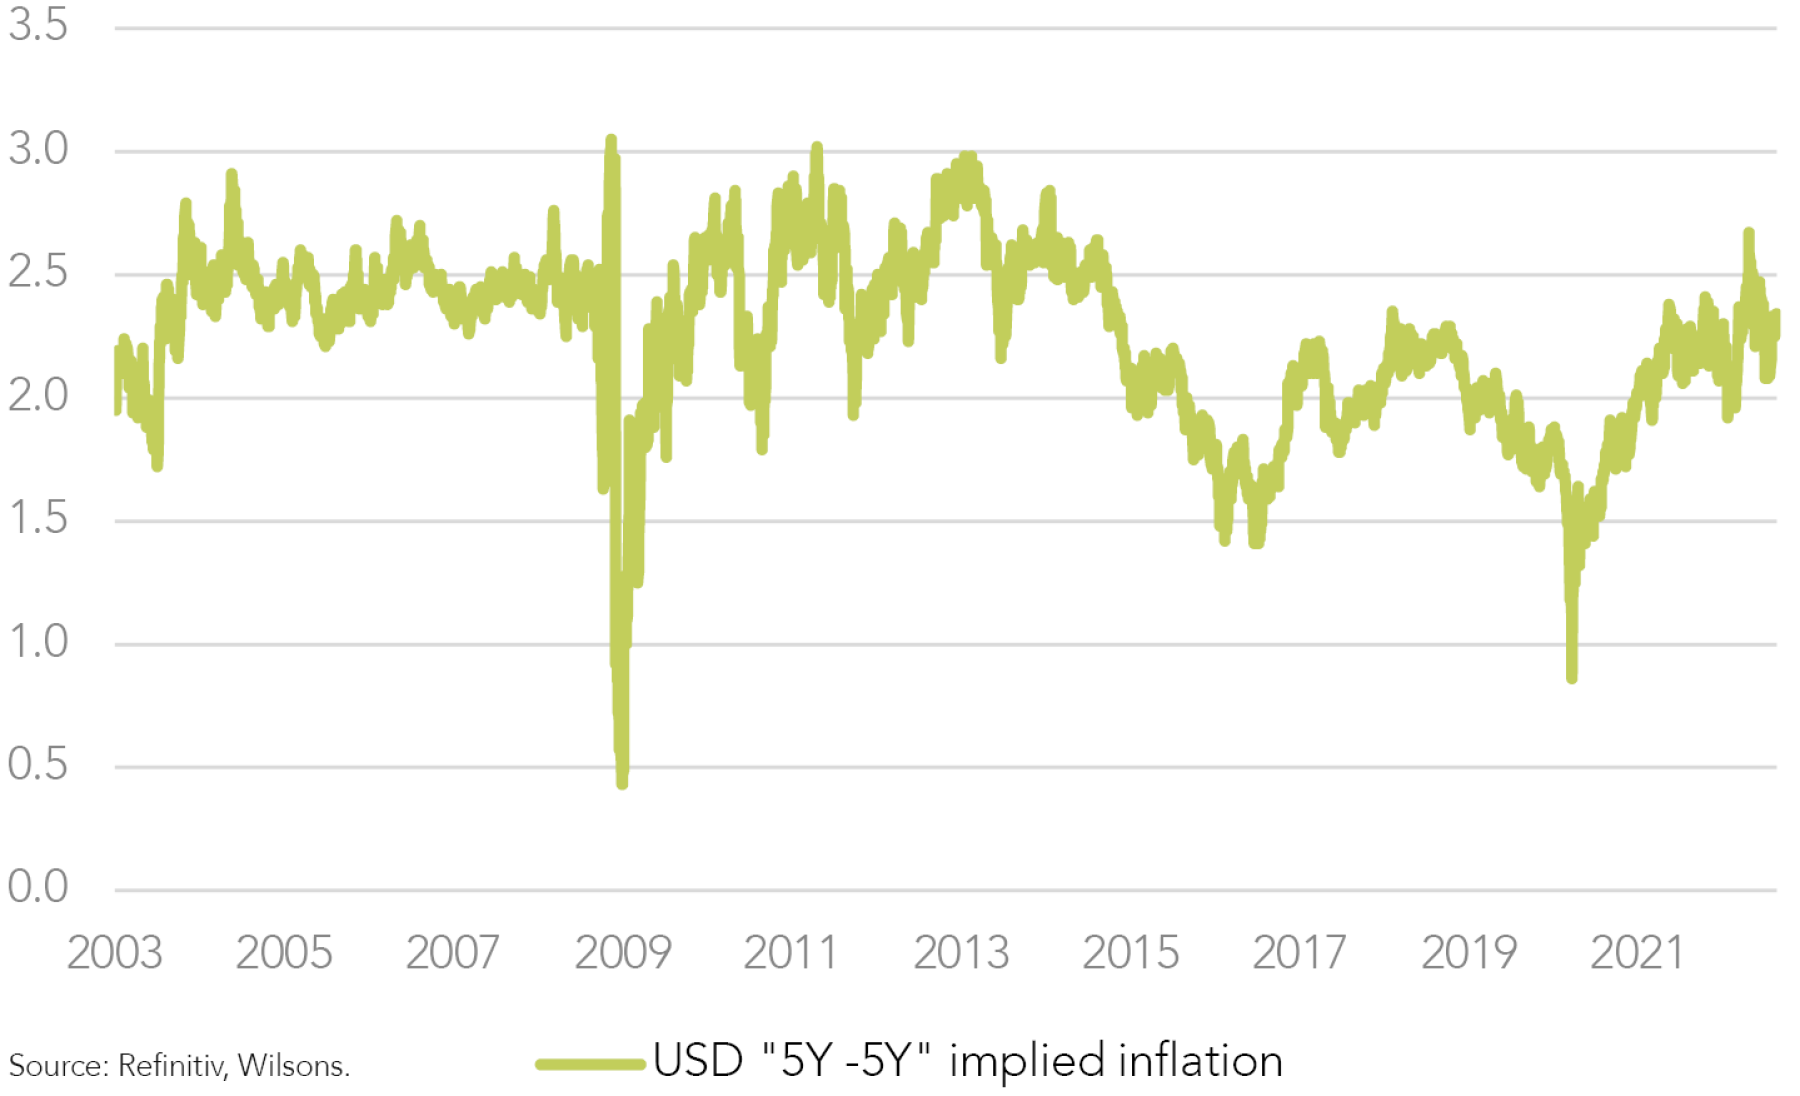
So, how do investors distinguish bear market rallies from genuine turning points? Ultimately, we think fundamentals will dictate the market’s medium-term trend. As a result, we are still watching inflation trends very closely. If US inflation has entered a significant downtrend (as we expect), then the Fed is much less likely to over-tighten and will have scope to ease policy at some point next year. This should mean the economy and earnings cycle will not come under too much pressure.
However, if inflation proves sticky, the Fed may do more than currently anticipated. This could take the form of further tightening by the Fed into early 2023 (in contrast to current expectations), potentially pushing the US economy into a significant recession some time in 2023, and driving big downgrades to 2023 earnings estimates.
As discussed, we lean towards the bull case with the upcoming US consumer price index (CPI) read in mid-September a key focus ahead of the Fed’s next meeting in late September.
US Trend will Dominate but Australia’s Recession Risk is Lower
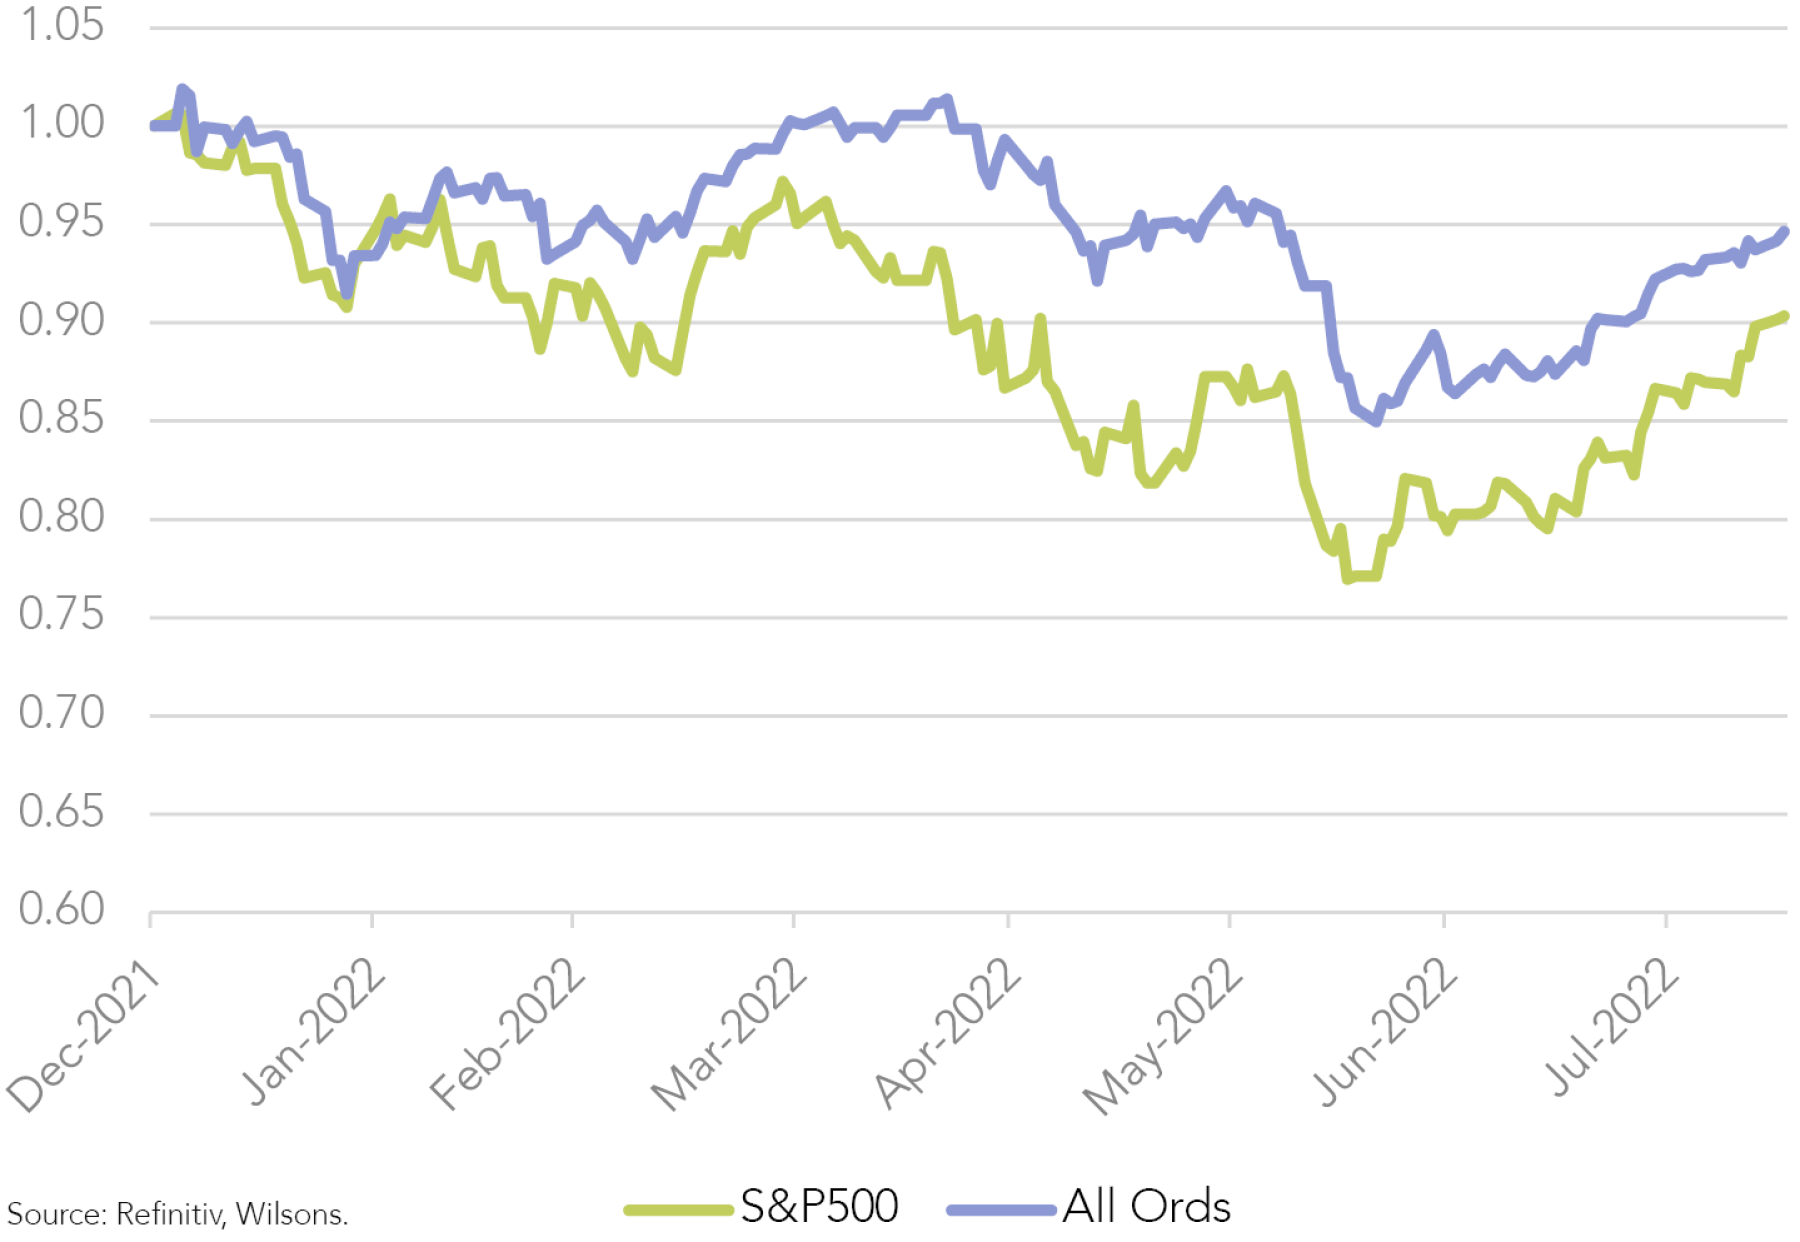
While the battle between bull versus bear scenarios in the US will likely dictate the direction of the local market at the margin, Australia does appear to offer a better cyclical risk-return tradeoff than many other regions. Australia has lagged in terms of both inflation and the monetary policy cycle.
While much has been made of the Reserve Bank of Australia’s (RBA) tardiness in terms of policy action, it could turn out to be a blessing in disguise. This is particularly the case if the global inflation problem does ultimately prove transitory, as we expect.
We see Australian inflationary pressures as significant but less intense than those facing the US and Europe. The RBA has more work to do, but is still lagging compared to the US and many other central banks. The negative interpretation is that inflation is a significant problem that needs to be dealt with and that the RBA has been very slow to act. The more optimistic interpretation is that inflation will indeed prove transitory, which would imply the RBA’s slow response may give our economy better prospects to achieve a soft landing in 2023. We expect local inflation to come under control in 2023, in part due to tighter domestic policy settings but also as a result of a waning global inflation pulse. This should encourage the RBA to halt the tightening cycle by the end of this year at around a 3% cash rate, or a touch lower, before it does too much damage.
Was the Market Unloved enough in June for a Genuine Bottom?
Typically, valuations are cheap at turning market points and sentiment is very negative. It could be argued that the market bottom in June did not meet those 2 criteria, particularly with respect to US market valuations.
We do not think the fact we never achieved bargain basement valuations in the US rules out the prospect of a durable market low. The low will hold if there is truly a sustained shift in what were the core drivers of the selloff - that is, inflation truly rolling over, bond yields tracing out a genuine peak, and the US economy achieving a softish landing.
However, the lack of genuinely cheap valuations in June may well mean that 12-month returns from the low are not as strong as typically seen in previous cycles.
| Major corrections & bear markets | % fall | Months | Forward price earnings ratio at bottom |
| Aug 87 - Dec 87 | -31 | 4 | 10.5 |
| Jul 90 - Oct 90 | -19 | 4 | 10.3 |
| Sep 00 - Jul 02 | -48 | 18 | 14.3 |
| Oct 07 - Mar 09 | -55 | 18 | 11 |
| May 11 - Oct 11 | -19 | 5 | 11.3 |
| Oct 18 - Dec 18 | -20 | 3 | 15.3 |
| Feb 20 - Mar 20 | -34 | 1 | 14 |
| Jan 22 - June 22? | -24 | 6? | 15.5 |
Source: Refinitiv, Wilsons.
Our Strategy View
We will continue to focus on US inflation as our key bull versus bear market indicator. Economic activity data remains an important secondary focus, with a not-too-hot, not-too-cold tone to such data likely to be the most favorable scenario over coming months. In particular, some easing in tight labor market conditions would be welcomed by the Fed. The tenuous situation in Europe and China continue to represent wildcards, but we agree with the market’s current view that these remain containable risks.
We stick with a neutral to marginally overweight position in equities, and an overweight in growth focused alternatives. We may be due for a near-term consolidation as equity markets digest the recent sharp rally before stocks move higher later in the year.
Australia looks relatively appealing on a 6- to 12-month basis, with reasonable valuations and lower recession risk. We do have some reservations regarding the Australian market’s medium- to long-term prospects, given the skew to banks and (iron ore) miners. We think investors will need to be reasonably active over the medium-term.
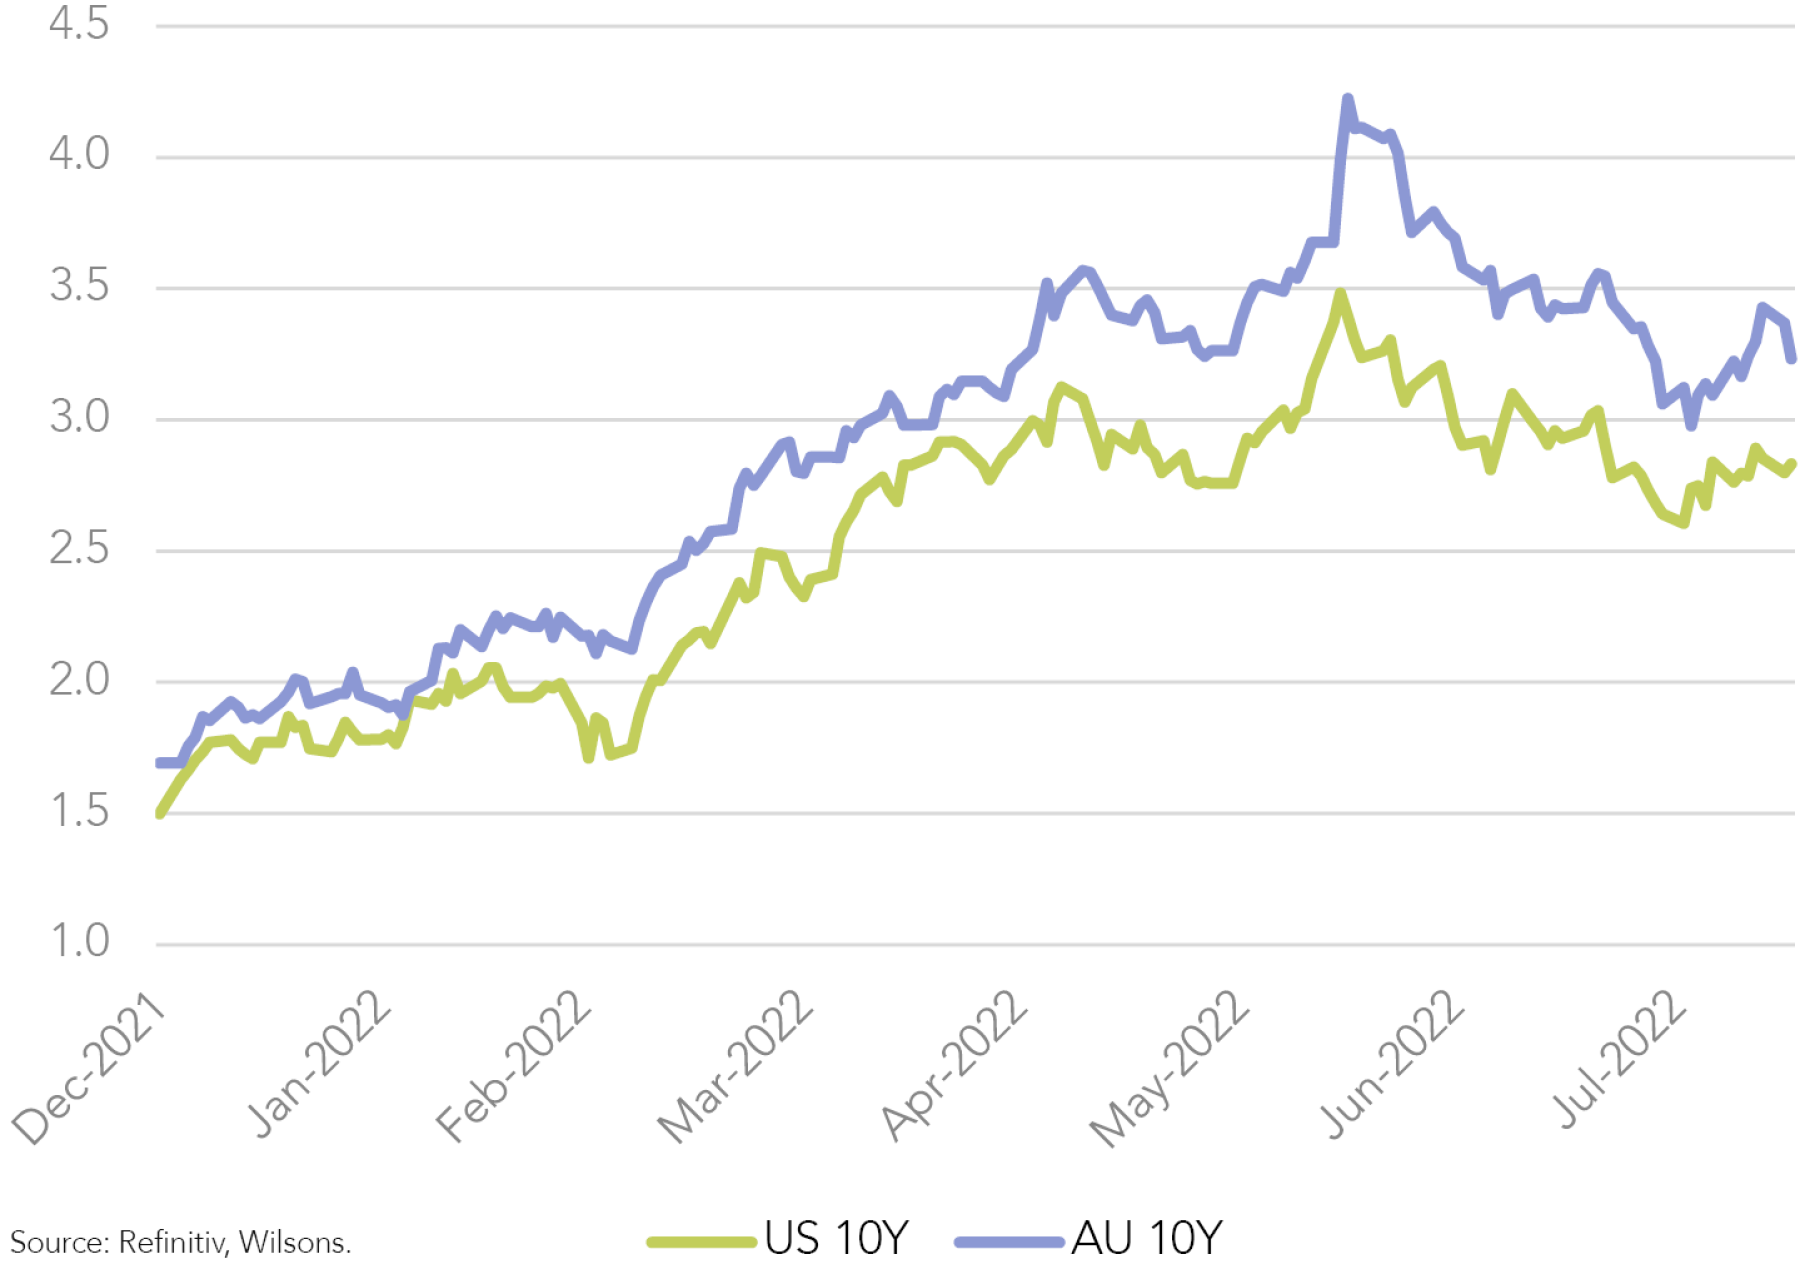
While our base case macro view is constructive, our return expectations are reasonably moderate. Uncertainty is still elevated, so we continue to seek diversification outside of equities. We removed our large fixed-interest underweight in late-June, following the big lift in yields, and we now see bonds in a range trading pattern.
| Major corrections & bear markets | % fall | Months | Performance 12 months after the bottom |
| Jan 73 - Oct 74 | -48 | 21 | 28% |
| Sep 76 - Feb 78 | -19 | 17 | 11% |
| Nov 80 - Mar 82 | -24 | 29 | 41% |
| Aug 87 - Dec 87 | -31 | 4 | 23% |
| Jul 90 - Oct 90 | -19 | 4 | 29% |
| Jul 98 - Oct 98 | -19 | 4 | 39% |
| Sep 00 - Jul 02 | -48 | 18 | 24% |
| Oct 07 - Mar 09 | -55 | 18 | 69% |
| May 11 - Oct 11 | -19 | 5 | 32% |
| Oct 18 - Dec 18 | -20 | 3 | 37% |
| Feb 20 - Mar 20 | -34 | 1 | 74% |
| Jan 22 - June 22? | -24 | 6 | ? |
Source: Refinitiv, Wilsons.
Inflation hedges (e.g., infrastructure) are appealing in a risk-return sense as they should do reasonably well if inflation proves sticky. However, if inflation eases and growth slows significantly, the defensive nature of infrastructure cashflows will provide support. Domestic floating-rate credit also continues to appeal as cash rates rise.

Written by
David Cassidy, Head of Investment Strategy
David is one of Australia’s leading investment strategists.
About Wilsons Advisory: Wilsons Advisory is a financial advisory firm focused on delivering strategic and investment advice for people with ambition – whether they be a private investor, corporate, fund manager or global institution. Its client-first, whole of firm approach allows Wilsons Advisory to partner with clients for the long-term and provide the wide range of financial and advisory services they may require throughout their financial future. Wilsons Advisory is staff-owned and has offices across Australia.
Disclaimer: This communication has been prepared by Wilsons Advisory and Stockbroking Limited (ACN 010 529 665; AFSL 238375) and/or Wilsons Corporate Finance Limited (ACN 057 547 323; AFSL 238383) (collectively “Wilsons Advisory”). It is being supplied to you solely for your information and no action should be taken on the basis of or in reliance on this communication. To the extent that any information prepared by Wilsons Advisory contains a financial product advice, it is general advice only and has been prepared by Wilsons Advisory without reference to your objectives, financial situation or needs. You should consider the appropriateness of the advice in light of your own objectives, financial situation and needs before following or relying on the advice. You should also obtain a copy of, and consider, any relevant disclosure document before making any decision to acquire or dispose of a financial product. Wilsons Advisory's Financial Services Guide is available at wilsonsadvisory.com.au/disclosures.
All investments carry risk. Different investment strategies can carry different levels of risk, depending on the assets that make up that strategy. The value of investments and the level of returns will vary. Future returns may differ from past returns and past performance is not a reliable guide to future performance. On that basis, any advice should not be relied on to make any investment decisions without first consulting with your financial adviser. If you do not currently have an adviser, please contact us and we would be happy to connect you with a Wilsons Advisory representative.
To the extent that any specific documents or products are referred to, please also ensure that you obtain the relevant disclosure documents such as Product Disclosure Statement(s), Prospectus(es) and Investment Program(s) before considering any related investments.
Wilsons Advisory and their associates may have received and may continue to receive fees from any company or companies referred to in this communication (the “Companies”) in relation to corporate advisory, underwriting or other professional investment services. Please see relevant Wilsons Advisory disclosures at www.wilsonsadvisory.com.au/disclosures.